


If the SaaS world is your natural habitat, you know that solid data fuels good decisions. But having loads of data isn’t enough.
Especially for startups and growing companies, marketing managers must turn this data into valuable insights.
And that’s where PPC (Pay-Per-Click) reporting comes in. It’s more than just a job to do. It’s more like an art form that requires skill and attention to detail. It involves:
- Carefully looking through essential metrics.
- Noticing trends.
- Using that information to guide your next moves.
Whether you’re trying to make sense of too much data, figuring out how to get the most from your budget, or navigating the challenges of a highly competitive market, this article aims to help.
We’re here to guide you in mastering the art of PPC reporting, turning what may seem like hurdles into stepping stones for success.
What is PPC reporting
At its core, PPC reporting is all about gathering data from your paid ads to figure out your next steps. It helps you decide whether to keep going as is, make some tweaks for better results, pause for a while, or even stop the campaign altogether.
In other words, it’s your roadmap for optimizing your advertising efforts and maximizing your budget.
Why PPC reporting is so crucial in digital marketing
Digital marketing has its charms—it’s fast, cost-effective, and can often yield results with just a small budget. Imagine spending just a dollar a day on platforms like Facebook or Twitter (ekhm, sorry — X) and already having enough data to gauge how things are going.
But here’s the catch: As advertising platforms have evolved, they’ve added more and more metrics for us to track. While that’s great for fine-tuning your campaigns, it’s also making life a bit tricky. The more data there is, the more time you’ll need to make sense of it all.
Why does this matter? Because time is money, especially in the fast-paced world of startups and scaleups. If you invest time and resources in paid promotions, you want to know it’s worth it.
That’s where PPC reporting comes in. By asking the right questions about what you’re trying to achieve with your campaign and pairing those with the right Key Performance Indicators (KPIs), you can create a report that’s not just packed with data but filled with insights.
This helps you make smarter marketing decisions without getting lost in a sea of numbers.
The Essential Components of a Good PPC Report
Creating an effective PPC report is like cooking a great meal—you need the right ingredients in the right proportions. For me, a well-rounded PPC report typically has three key elements:
- Figures: These give you a snapshot of your PPC performance, usually presented in tables. They’re essential for those who love crunching numbers and diving deep into analytics.
- Graphs: A picture is worth a thousand words, and graphs quickly show how your PPC campaigns change over time. They offer a visual representation that almost everyone can appreciate.
- Narrative Analysis: This is the storyteller’s touch—explaining what the data actually means. While number-lovers might skim this part, those with a more qualitative focus often find it incredibly useful.
Online tools might auto-generate the first two elements for you, but that third piece usually needs human input.
The challenge? Making sure your PPC report doesn’t just throw data at you but presents it in a way you can understand and act upon.
After all, what’s the point of a PPC campaign if you can’t interpret its performance to make better decisions?
By combining these three components effectively, you’ll have a PPC report that informs and empowers you to refine your advertising strategies for maximum impact.
Key Metrics in PPC Reporting
Choosing the right Key Performance Indicators (KPIs) is a crucial step in PPC reporting, and it’s not as simple as it sounds. Your KPIs should align closely with your advertising goals and be just the right amount—not too few and not too many.
Easier said than done, right?
Here’s a simple guideline I use for picking the most relevant metrics. Essentially, I categorize performance metrics into one of two buckets:
- Acquisition Metrics
- Non-conversion Metrics
Dive Deeper into Acquisition Metrics
Acquisition metrics are your go-to numbers for understanding how effectively your PPC campaigns convert clicks into tangible results. Here’s a rundown of the key metrics you should be watching:
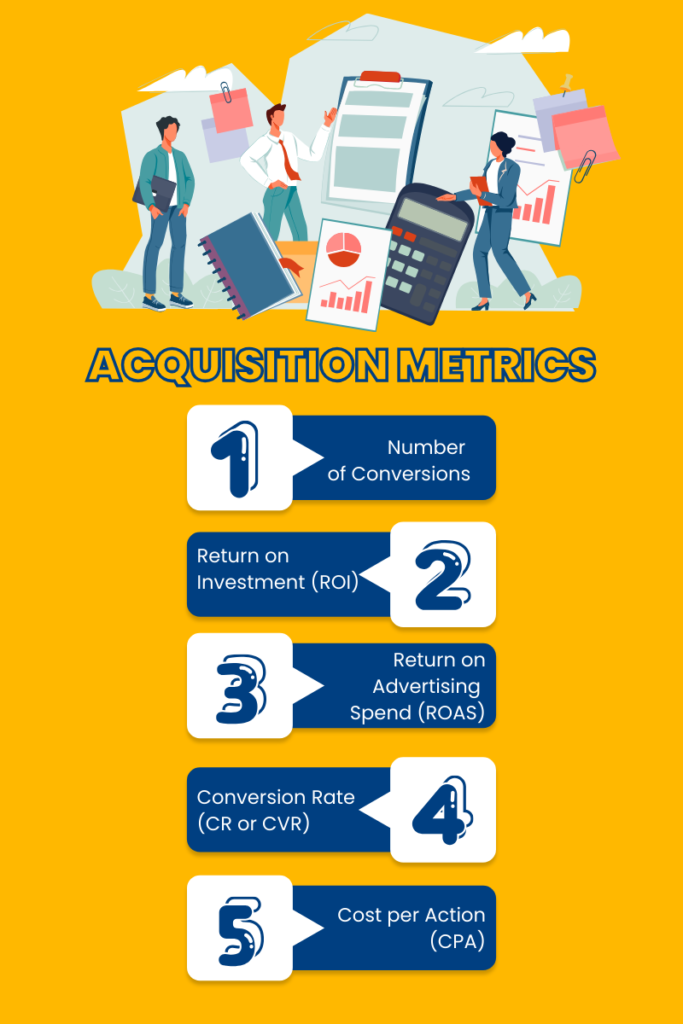
Number of Conversions
This tells you how often a user has taken a desired action, like purchasing or signing up for a newsletter. It’s a direct measure of your campaign’s success.
Return on Investment (ROI)
ROI gives you the big picture of profitability. It’s calculated as follows:
ROI = (Net Profit / Net Spend as investment) x 100 (%)

Understanding ROI helps you measure how effectively your advertising spend is turning into real earnings.
Return on Advertising Spend (ROAS)
ROAS is more specific to your ad costs, calculated as:
ROAS = (Revenue Generated from Ads / Advertising spend only) x 100 (%)
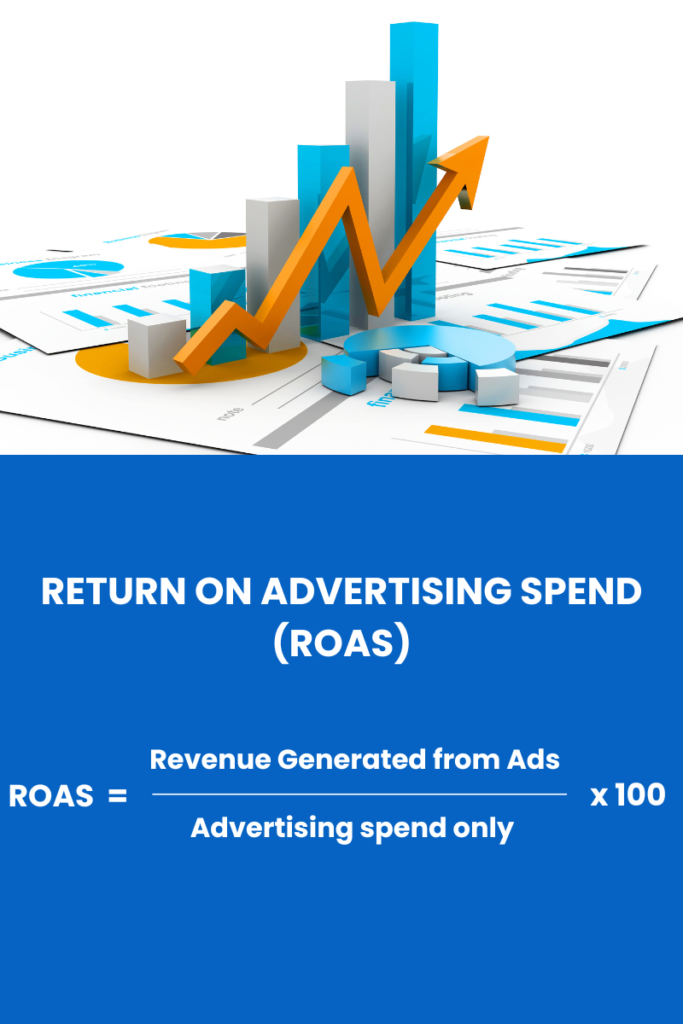
This metric focuses solely on the returns you get from your advertising budget, helping you understand how hard your ad dollars are working.
Conversion Rate (CR or CVR)
Whether you use CR or CVR, the formula is quite similar:
CR = (Number of conversions / Number of clicks) x 100 (%)
CVR = (Number of converted users / Number of clicking ad users) x 100 (%)
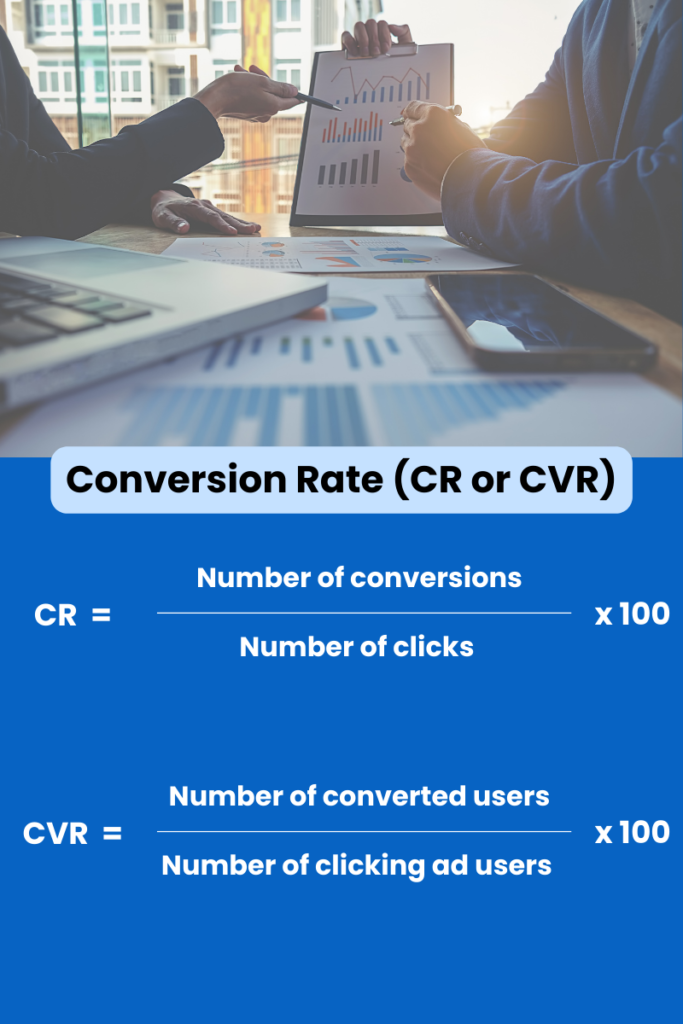
These rates give you an idea of how successful you are at converting clicks into actions.
Cost per Action (CPA)
This is a straightforward metric:
CPA = (Cost of advertising / Number of your defined action) x 100 (%)
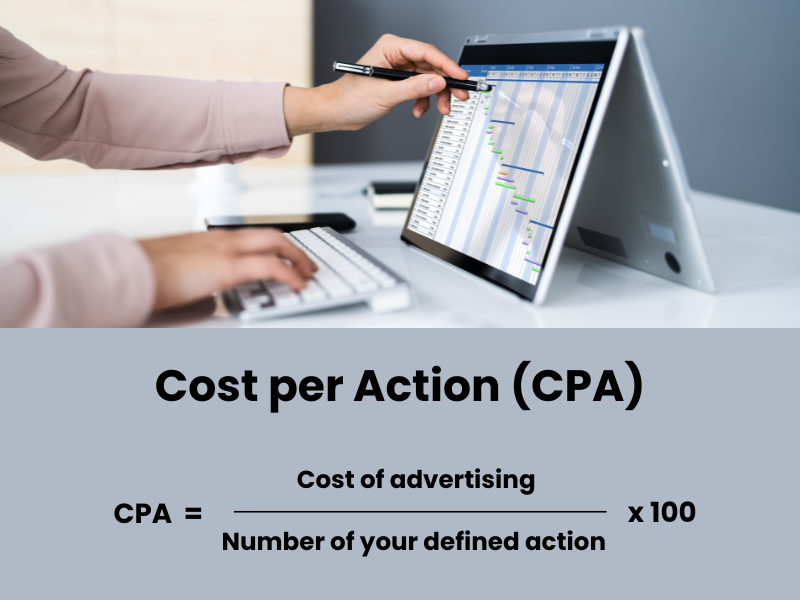
Often, CPA is looked at as the Cost per Acquisition, essentially your cost per conversion. The lower, the better. A popular variant is CPL (Cost Per Lead), which focuses on how much you pay to acquire new contacts.
In summary, when looking at a PPC report, my go-to sequence is the number of Conversions, then ROAS/ROI, followed by CPA and CR. Occasionally, I’ll examine metrics like „Audience Essence” to get a fuller picture of performance.
Explore Non-Conversion Metrics
While conversion metrics give you a close look at your immediate ROI, non-conversion metrics offer a broader view of how your PPC campaigns are performing. They focus on how effectively your content reaches your target audience and builds brand awareness.
Here’s what to look for:
Click-Through Rate (CTR)
The CTR tells you how many people clicked on your ad relative to how many saw it. Calculated as:
CTR= (Number of clicks / Number of impressions) x 100 (%)
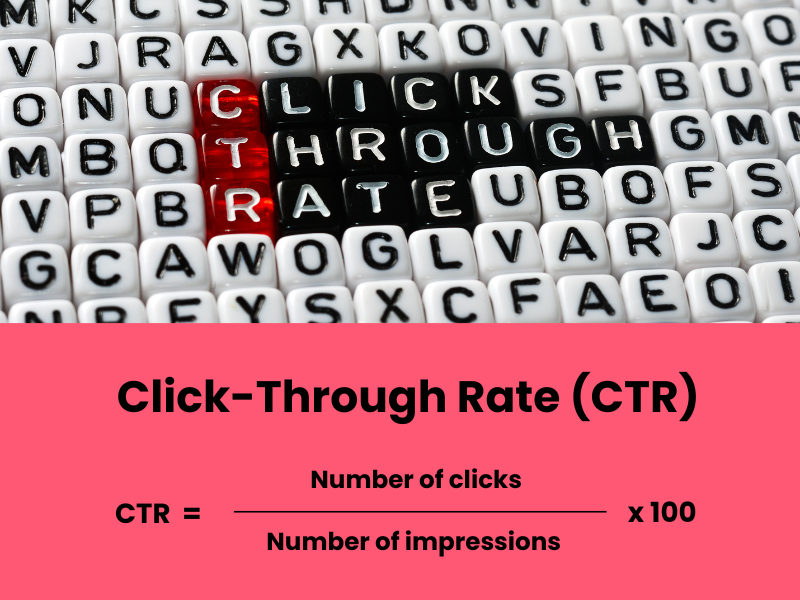
A high CTR often indicates an ad’s attractiveness, not necessarily the keyword or audience targeting. It’s crucial for campaigns that drive web traffic and if your campaign goal is conversions. Still, they’re slow to materialize, so improving your CTR is an excellent early optimization strategy.
Cost Per Click (CPC)
CPC helps you understand how much you’re paying for each click:
CPC = (Amount of money spent on advertising / Number of clicks obtained) x 100 (%)
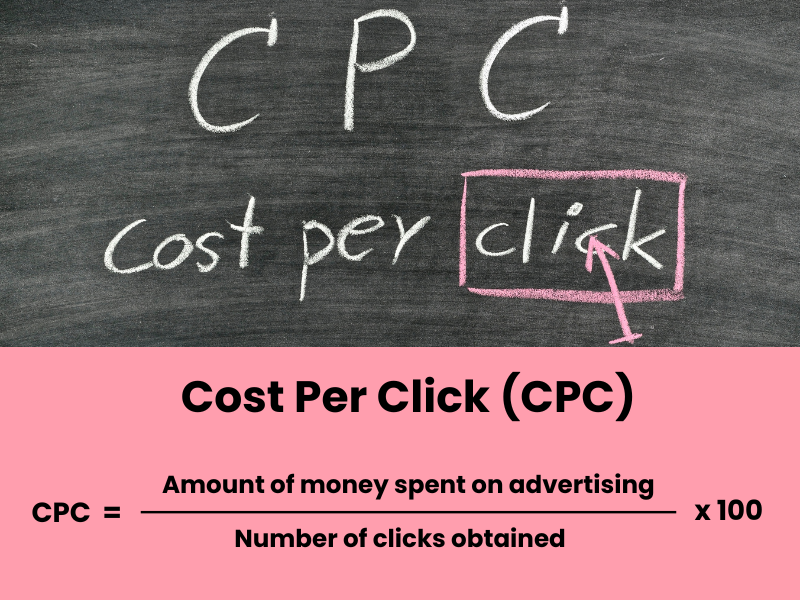
The lower the CPC, the better, especially when your primary aim is to generate traffic to your site. Keep in mind that CPC can vary widely based on targeting settings, the type of audience, ad formats, and timing. Interestingly, a higher CTR usually leads to a lower CPC.
These non-conversion metrics are vital for understanding your campaign’s broader impact. They help you gauge how efficiently you spend your advertising dollars to reach and engage your audience, especially when working with limited budgets. Understanding the interplay between CTR and CPC becomes even more crucial if you’re operating on a shoestring budget, like $10/day. A lower CPC means more clicks for your buck, making each advertising dollar go that much further.
Delve into Additional Parameters
Beyond the standard PPC metrics, some additional parameters can help you sharpen your PPC campaign strategies. These give you an edge in making your paid advertising more cost-effective and impactful.
Quality Score
Your Quality Score gives insight into how relevant and useful your ad is to the user based on Google’s estimation. A higher score can result in lower costs and better ad positions, making it an essential metric for optimizing PPC performance.
Essence of Audience
I like to call this the „Essence of Audience.” It’s a measure of audience quality, calculated as:
Essence of Audience = (Number of audiences (reach) / Number of conversions or clicks) x 100 (%)
The lower the score, the better. This metric is particularly useful when comparing the effectiveness of campaigns across different advertising platforms or between various audience groups. For example, securing one conversion from an audience of 800 is much more efficient than one conversion from an audience of 6,000.
In a nutshell, these additional parameters are like your secret sauce. They provide nuanced insights that allow you to optimize your PPC ad campaigns beyond the basic metrics, helping you to advertise smarter and more competitively.
The Anatomy of a Thorough PPC Report
Creating a comprehensive PPC report isn’t just about throwing in some numbers and charts. It’s about providing a detailed roadmap that shows what’s working, what’s not, and why. Let’s delve into the critical elements of a top-notch PPC report.
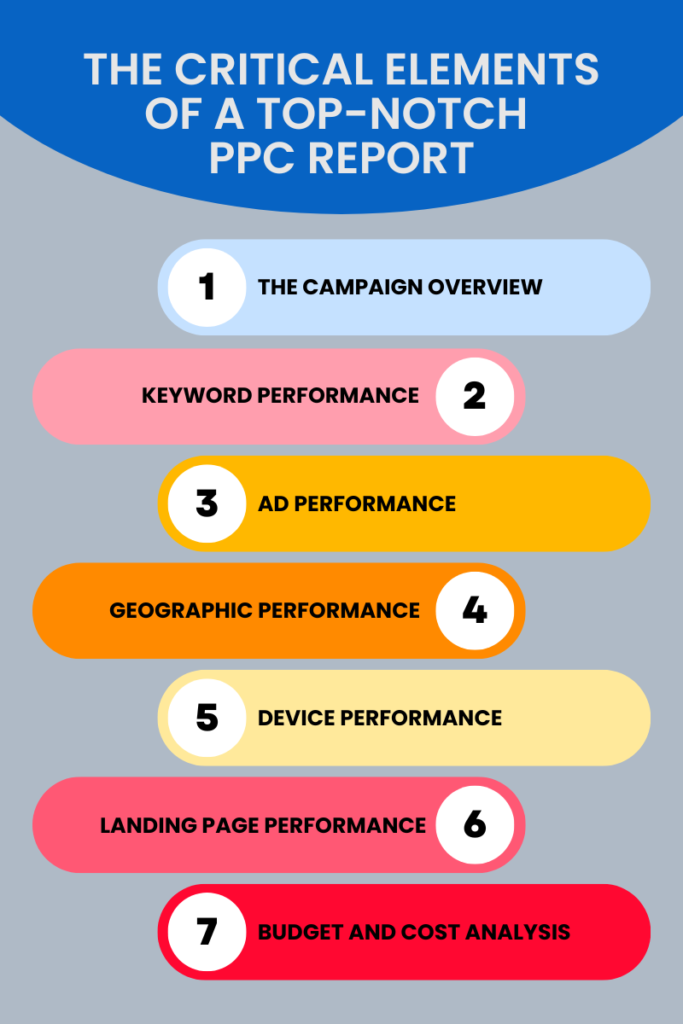
The Campaign Overview
This is your high-level snapshot of all your paid campaigns. At a glance, you can see key metrics like ad spend, impressions, and conversions. Think of it as your litmus test for the overall health of your marketing campaign. It’s more for a quick „status check” rather than an in-depth analysis.
Fine-Tune Your Focus on Keyword Performance
The Keyword Performance section is an invaluable component of a complete PPC report. It serves as a detailed dashboard, illustrating which keywords are not just hogging the limelight by frequently triggering ad displays but also consuming a sizable portion of your budget.
Most importantly, it reveals the impact of these keywords on driving web traffic and facilitating conversions.
This section is indispensable for any ongoing analysis of a marketing campaign. As you review the report, you may choose to phase out keywords that demonstrate:
- High numbers of impressions but scant clicks or conversions.
- Disproportionately costly conversions.
- Suboptimal performance that drains resources from other more promising keywords.
In recent years, the advent of Dynamic Search Ads (DSA) has added a layer of automation to keyword selection. DSAs scan your website’s content and autonomously select relevant keywords based on a user’s search query. While this may sometimes result in ads that lack stylistic finesse, the time saved in keyword optimization can be significant. For its effectiveness, DSA is highly recommended as a feature in your paid campaigns.
Additionally, keeping an eye on the search term reports from Bing and Google can offer further insights. These reports show the actual queries that triggered your ads. As you expand keyword matching options, more data becomes available, revealing shifting patterns in user behavior. These insights can guide you in updating your keyword strategies, ensuring that your advertising remains aligned with how users are searching for information online.
Dissect Ad Performance for Optimized Impact
The Ad Performance segment of a PPC report is a vital tool for gauging the efficacy of your ad messaging. This report helps you delve into the nuances of which ads have made the most impact and why. The primary questions that this section aims to answer are:
- Which ads yielded the highest ROI or ROAS, minimized the cost per conversion, and excelled in conversion rates (be it CR, CPA, CPL, etc.)?
- For ads that didn’t lead to conversions, which ones boasted the highest click-through rates (CTR)?
It’s important to note that an ad with a soaring CTR doesn’t automatically guarantee conversions; it could simply be eye-catching without compelling action. Conversely, an ad with less-than-stellar creative elements could still drive conversions effectively.
In this section, you’re essentially playing detective, seeking clues that shed light on the persuasive elements of your ads.
By dissecting these varying aspects, you can refine your approach to crafting ads that not only capture attention but also motivate action, ultimately boosting your campaign performance.
Unpack Geographic Performance for Targeted Outreach
The Geographic Performance section is a cornerstone in any comprehensive PPC report. Routinely consulted, this section provides insights into the geographical origins of your search queries, users, and conversions.
Moreover, it does so at multiple layers of granularity, typically including:
- Country-level data,
- State, province, or regional data,
- City-specific data, (- and even district-level data in some major global cities).
When managing ad campaigns across diverse locations, decoding this report can become complex and time-consuming. Despite this challenge, omitting geographic insights in client reports is a critical oversight. It’s essential to align this campaign data with your internal database to confirm whether the areas you’re heavily investing in are indeed generating tangible applications and orders.
In summary, this section enables you to strategically adjust your marketing efforts based on geographic performance, ensuring that your ad spend is allocated most effectively to yield the highest ROI.
Analyze Device Performance for Optimized Reach
In the realm of PPC campaigns, Device Performance can often play a supplementary but significant role in shaping the overall success of your marketing initiatives. With the long-standing „mobile-first” strategy that has been adopted industry-wide, it’s no surprise that over 80% of internet traffic now originates from mobile devices. Consequently, this is where a large chunk of your PPC budget will likely be consumed.
Notably, only a select few advertising platforms like Bing, Google, and Meta provide the option for granular device targeting; most other platforms do not offer this level of customization. Despite the mobile-centric approach, it’s crucial, especially when reviewing PPC reports, to evaluate whether desktop traffic isn’t yielding better results. If that’s the case, reallocating more budget towards computer users may be a strategic move.
Look at Landing Page Performance
If you’re aiming to generate leads or wonder how many conversions you’re getting from your landing pages, some platforms like Google, Bing, and a few from the Meta suite offer useful reports. These reports provide insights into which pages are most effective in drawing traffic to your website and at what cost.
A crucial detail to note is whether a specific landing page features in the customer journey that ultimately leads to a conversion. This tells you the role that page is playing in turning a visitor into a lead or customer. If you have multiple landing pages for your campaign, this report can help you identify which one is more successful in generating leads and conversions.
I don’t check this report very often, mainly because if the landing pages are pretty similar, the outcomes won’t vary much. But it’s worth a look every so often if you’re keen to optimize your landing pages’ role in the customer journey.
Navigate Budget and Cost for Effective Campaign Spending
Budget and Cost Analysis can typically be a tailored report you create using tools like Excel, Tableau, or even Google Analytics. This report is valuable for assessing your ad spend and seeing what kind of return on investment you’re getting.
Periodically reviewing this report helps guide decisions on where to allocate future budgets for optimal results. It offers a straightforward look at which marketing channels are either more effective or more cost-efficient for reaching your target audience.
However, it’s worth noting that Google Analytics can sometimes muddle the attribution of conversions and revenue sources. For example, it might not properly track the traffic originating from certain platforms like TikTok. As a result, while useful, Google Analytics isn’t always the most reliable tool for a complete budget and cost analysis.
PPC Reporting Across Various Platforms
Master Google Ads Reporting
Google Ads takes the crown when it comes to PPC reporting tools. It features a designated „Statistics and Reports” section and a unique „Report Editor” that offers immense flexibility for data compilation.
Here, you’ll find a variety of ready-to-use templates that mirror your advertising panel’s settings. But what sets Google Ads apart are the custom configuration options. You can create tables and charts like lines, histograms, bars, pie, and point charts.
Google Ads campaigns offer a wealth of advanced capabilities. I highly recommend focusing on crafting multiple specialized reports to address specific business queries rather than one exhaustive report that aims to cover everything.
Simplify Bing Ads Reporting
Bing Ads offers a user-friendly reporting interface, although it has fewer features than Google Ads. You’ll find a „Reports” section directly in the menu that is easy to navigate.
While it might lack more complex features like conversion goal summaries with location data or chart visualizations, the tabular data is sufficient for a comprehensive PPC report. Bing Ads might be simpler, but they serve the purpose of PPC advertising analytics.
Navigate Facebook Ads Reporting
Facebook, now part of Meta, provides a separate „Reports” section within its interface. It offers many parameters for evaluating your PPC ads—around 360 built-in options plus custom conversions and events.
However, it does have its drawbacks. Sometimes, due to data overload, the table fails to display figures. While the platform provides some chart options, they are relatively limited. It’s worth noting that specific metrics are unique to Meta, making it challenging to compare attribution data across major ad platforms.
The Challenges of LinkedIn Ads Reporting
LinkedIn Ads has its fair share of difficulties regarding PPC reporting. Unlike other major ad platforms, it doesn’t offer a distinct section for customized reports. Your only option is to work within the Ads Manager panel. While you can export data to files like .csv, you’re restricted to downloading default reports.
LinkedIn Ads is a more cumbersome channel for PPC reporting, especially for those without IT expertise who might want to pull data through scripts.
Tips for Crafting Useful PPC Reports
Align Your PPC Reports with Business Goals
Concentrate on what truly matters for your business goals. If conversions are your primary focus, zero in on the key metrics like how many conversions you’ve gotten, ROI/ROAS, and CPA.
Compare your current data with past periods, and even go as far back as a year to identify seasonal trends. This approach keeps your PPC reports aligned with business objectives and enables better decision-making.
Use the Right Tools for PPC Reporting
Let’s talk about where you’re pulling all this info together. While good old Excel is often a go-to, it might not fit everyone best.
Other tools, like Tableau, are designed to help you get a bigger picture by bringing together data from your ads and your internal records. It’s like having a single dashboard where you can see how everything’s going.
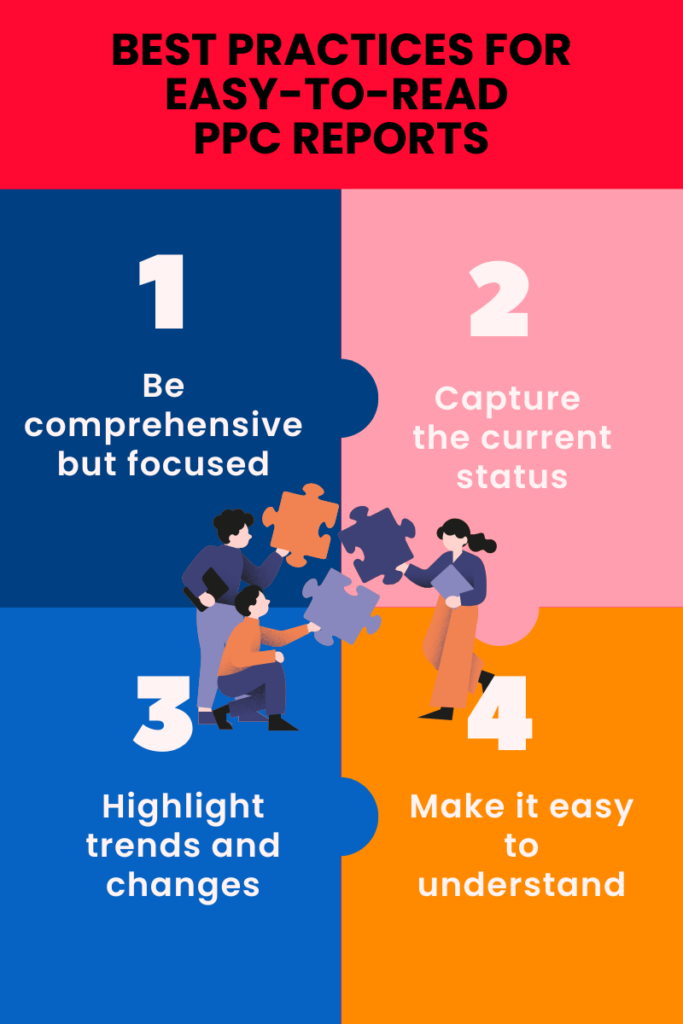
Best Practices for Easy-to-Read Reports
When it comes to making a PPC report that’s both thorough and easy to understand, consider these best practices:
- Be comprehensive but focused: Your report should cover all critical aspects without overwhelming the reader with too much information.
- Capture the current status: Provide a snapshot that answers the „What’s happening now?” question.
- Highlight trends and changes: Visual cues, like charts or graphs, can make spotting trends easier and faster for everyone.
- Easy to interpret: The report should be straightforward so even those who aren’t PPC experts can understand what’s happening.
Before creating your report, list questions you and your team might have. Whether it’s the graphic designer curious about which visuals performed best or the content specialist wondering which topics resonated most, include those queries in your analysis.
In addition to presenting raw numbers like „348 sales,” consider showing how those figures have changed over specific periods. Context matters, so offer month-to-month or year-to-year comparisons.
Lastly, take into account the power of a good narrative. Including insights from your analysis—whether it’s about optimization tweaks or changes in external conditions—can provide valuable context for the numbers.
By following these guidelines, your PPC reports can be a clear and effective tool for understanding campaign performance and making informed decisions.
Are you ready for better results?
Running advertising campaigns without a solid PPC reporting approach is a road to nowhere. In this guide, we walked you through the:
- key PPC metrics
- structure of a thorough PPC report
- PPC reporting tools and dynamics across the biggest platforms
- and best practices to implement in your future campaigns
But if you really want to drum up your results, find out how to discover opportunities, learn from mistakes, and optimize your PPC, click here.
And if you need help with your PPC strategy and next ad campaign, the Cayenne Flow team is here. Book your discovery call today!
ps. And check out other articles on Cayenne Flow’s blog.